
Back to Projects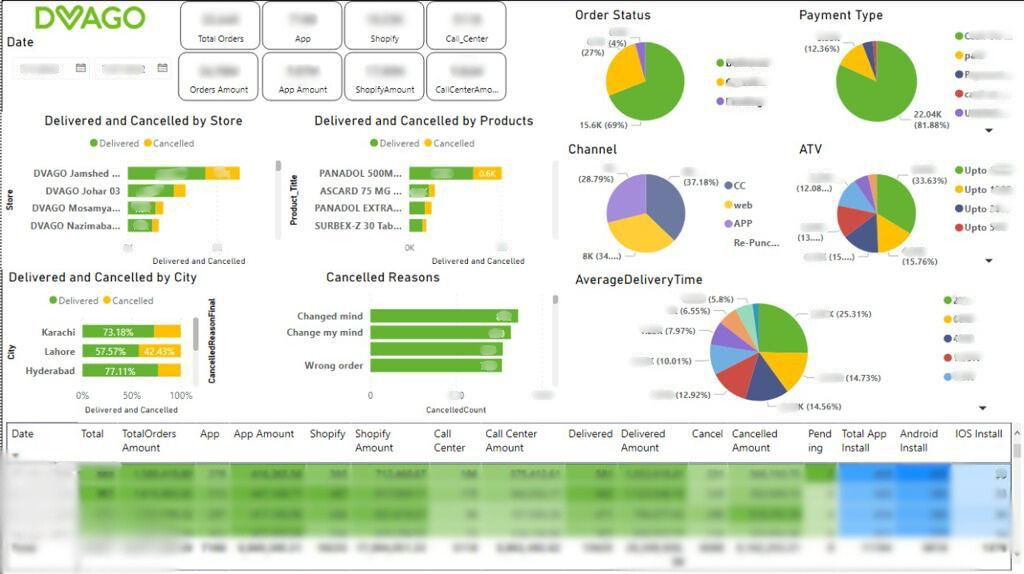
Business Intelligence
Dvago Analytics Dashboard
Led the development of a business intelligence dashboard for Dvago's e-commerce and operations teams. Integrated Power BI with SQL Server, Python, and Excel to deliver real-time data visualizations, advanced KPI tracking, inventory optimization, and predictive analytics. Built multiple dashboards including E-commerce Sales, Rider and Agent Performance, Delivery Metrics, Branch Performance, Customer Insights, and Finance Reconciliation. Used Dataflows, DAX, and Power Query to automate data modeling and report generation, significantly improving data accessibility and executive decision-making.
Key Features
- Real-time data visualization
- Custom dashboards for all departments
- Predictive analytics and forecasting
- Automated dataflows and DAX modeling
- Cross-platform reporting (Web, Excel, PDF)
Challenges
- Visualizing large-scale transactional data
- Building scalable and reusable report templates
- Real-time sync between SQL and Power BI
- Ensuring KPI accuracy and stakeholder alignment
Results
- Reduced manual reporting by 80%
- 50% faster decision-making across departments
- 90% accuracy in sales and stock forecasting
- Improved cross-functional visibility and performance tracking
6 months
Team: 10+ analysts
Role: BI Developer
Technologies Used
Power BI
SQL Server
Python
Excel